Need help with a project?
Launch your online presence, build your MVP, or scale up with tailored solutions. We adapt to your unique needs and help you grow from concept to success.
Launch your online presence, build your MVP, or scale up with tailored solutions. We adapt to your unique needs and help you grow from concept to success.

So you have a website, but how do you know if it’s a good website? One tool that has become extremely popular is Google’s PageSpeed Insights or the Lighthouse score. The goal of this benchmark is fairly simple: emulate the website in a reasonable environment and test its performance and user experience. However, this process generates a massive amount of information to analyse. Let’s go through it all.
Using Google’s PageSpeed Insights, part of the widely recognized Lighthouse tool suite, provides vital information on website performance metrics such as Core Web Vitals and accessibility.
Both Lighthouse and PageSpeed Insights use the Lighthouse engine, but they run in different environments.
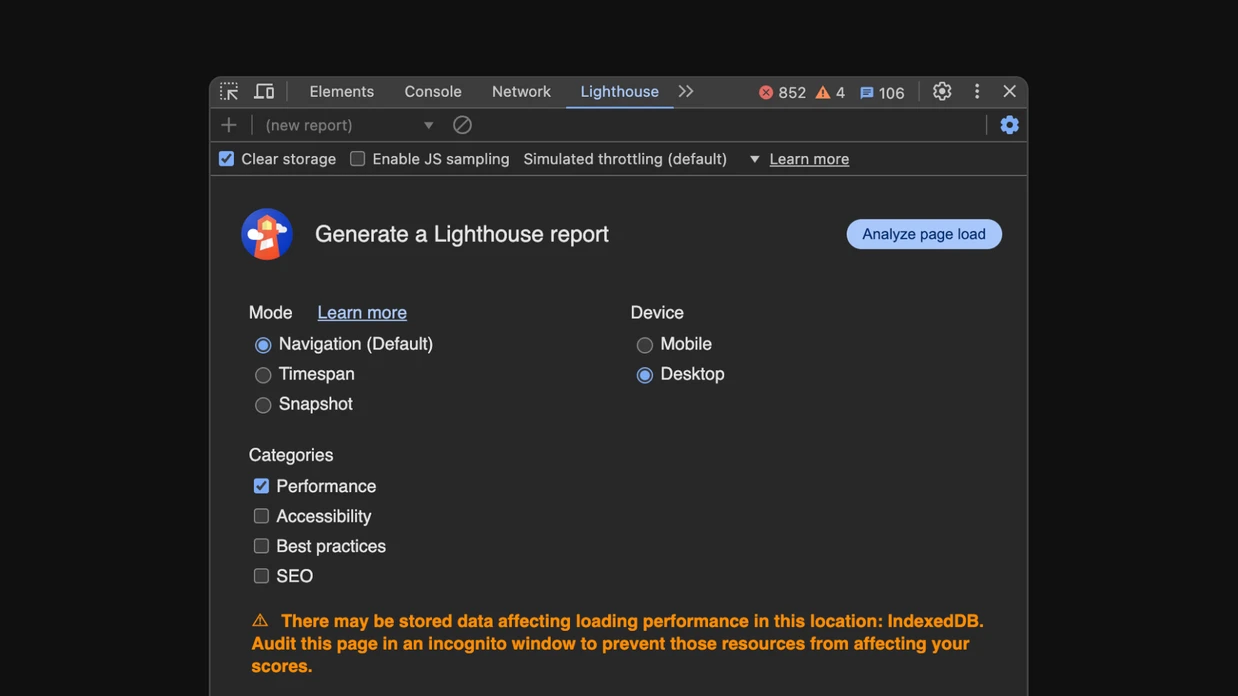
Lighthouse can be run locally through Chrome DevTools, as a Node module, or in a CI environment. This means if you’re using something high-spec, you’ll get more favourable results. Usually, this is for testing everything other than performance. Also, try running the local test in incognito mode to avoid extensions or stored data from impacting results.
PageSpeed Insights, on the other hand, runs on Google’s servers which provides a more consistent environment for testing. Although external factors like a database starting up or no cached version being available can potentially influence the results.
PageSpeed Insights is not perfect, but many people think of these scores as absolute indicators of what makes a good site. It’s gotten to the point where some will fake a 100 overall score or focus solely on PageSpeed Insights rather than genuinely improving their site.
Websites today have a lot going on, from caching, CDNs, server/client rendering and hydration to different runtimes, Lambdas, and server actions (if you don’t know what these mean, that’s okay). As you can tell, it’s not simple at all. And that’s part of the problem: PageSpeed Insights doesn’t know your website; it can only take your site at face value.
Perhaps your site uses clever tricks like pre-loading the next page when a link is hovered over to reduce load times, or maybe your site is specifically targeted at desktop users, so you have 3D backgrounds, images, and videos. Desktops generally have more power, so handling 3D elements is not too difficult, but you’ll be sacrificing your site’s mobile performance. PageSpeed Insights doesn’t have the context to understand who your target audience is or what special/complex technologies you’re using.
Take, for example, Stripe (one of the most popular payment processing platforms). Their website has been an inspiration with its amazing layout, UI/UX design, animations, assets, and more. As an insanely large company that has put immense focus on its developers, you’d think their main site is optimised to the moon, right?
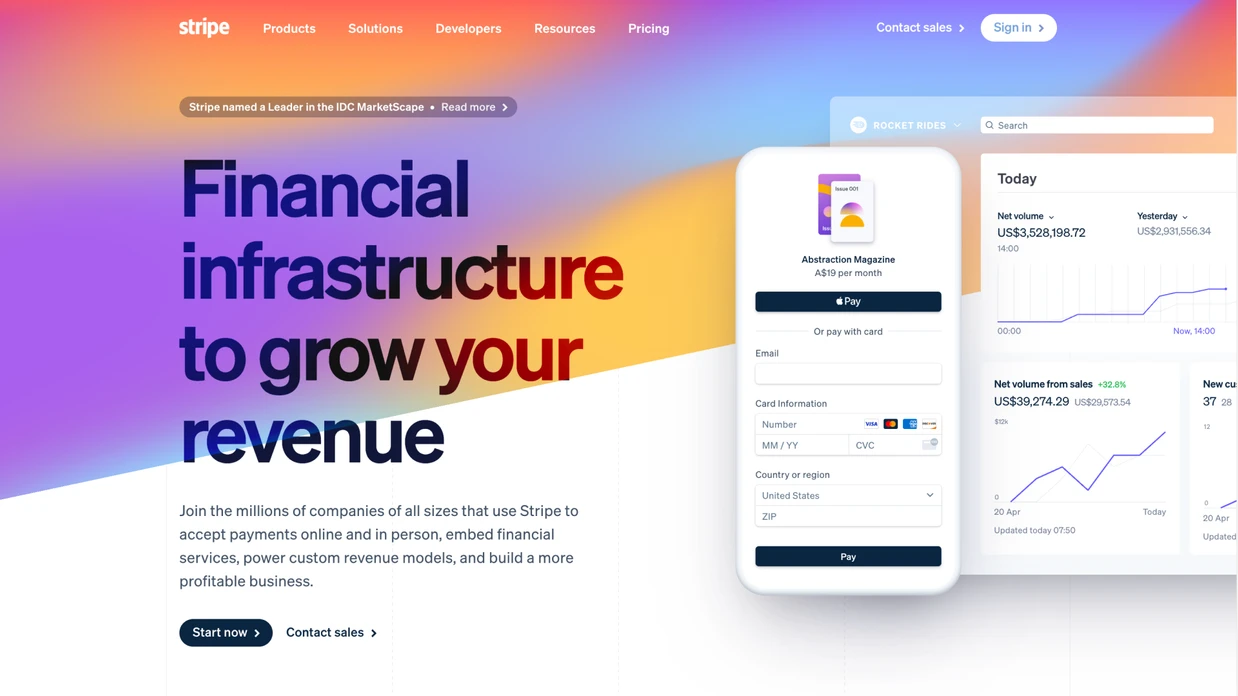
But if you run a PageSpeed Insight test on their front page, you’ll notice something interesting:
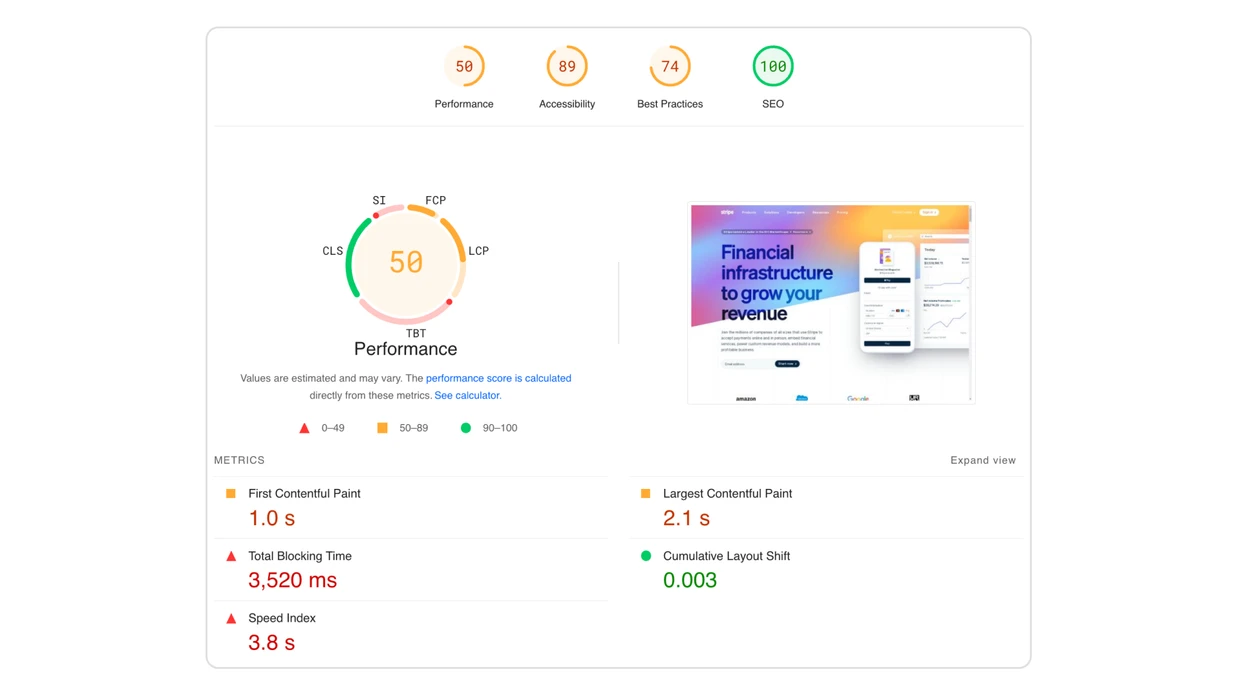
Hmmm… That’s interesting. Even if the site looks and feels incredible, the performance, accessibility, and best practices scores are below what would be considered good. See, Stripe doesn’t really need insanely optimized load times because they’re the industry standard. People will click their site regardless. Even without being an industry giant, if your site is making use of things like CDN caching, server-rendered components, dynamic pages, pre-fetching pages, etc., then PageSpeed Insights should be interpreted a little differently.
Everyone wants to rank on Google. But Google wants good websites to rank, so they started putting an emphasis on performance, load times, accessibility, etc., all to give a better user experience.
PageSpeed Insights also lets you know where you can make some quick adjustments to have a better site. For example, if you’ve forgotten to resize and optimise images, if you left unused JavaScript in your code, or perhaps you need to add caching, PageSpeed Insights can help you figure these things out.
Sometimes, we just can’t do anything about something lowering our score.
BleedingTech loads something called Microsoft Clarity that lets us know about dead-clicks, user heat maps, or scroll depth (it’s GDPR compliant, so no actual user data is stored). But a problem is that the script tag given by Microsoft doesn’t have any caching, so PageSpeed Insights takes away a point and gives us a warning. Realistically, users wouldn’t even notice this since it only loads after everything else has loaded. Obviously, we can’t call up Microsoft and demand they add a caching policy (plus, there are actual reasons why they shouldn’t).
Or, we have illustrations built with HTML and CSS, and so the test thinks it’s part of the page, but it’s not meant to be read or interacted with—it’s just there to look nice.
Nevertheless, running the test after every major change to your site can help ensure you’ve done all you can to have a really good website, at least in terms of performance and SEO.
There are two main sections: core web vitals and the actual lighthouse test.
The core web vitals are the 6 most important performance metrics for a site. Within the PageSpeed Insights context, these come from Field data. Field data is collected from real users and it provides insights into how real users experience your site, which complements the lab data. Lab data refers to the Lighthouse test. Field data may not be available if there aren’t enough visitors on your site but is essential for understanding real-world performance as it’s based on actual user interactions.
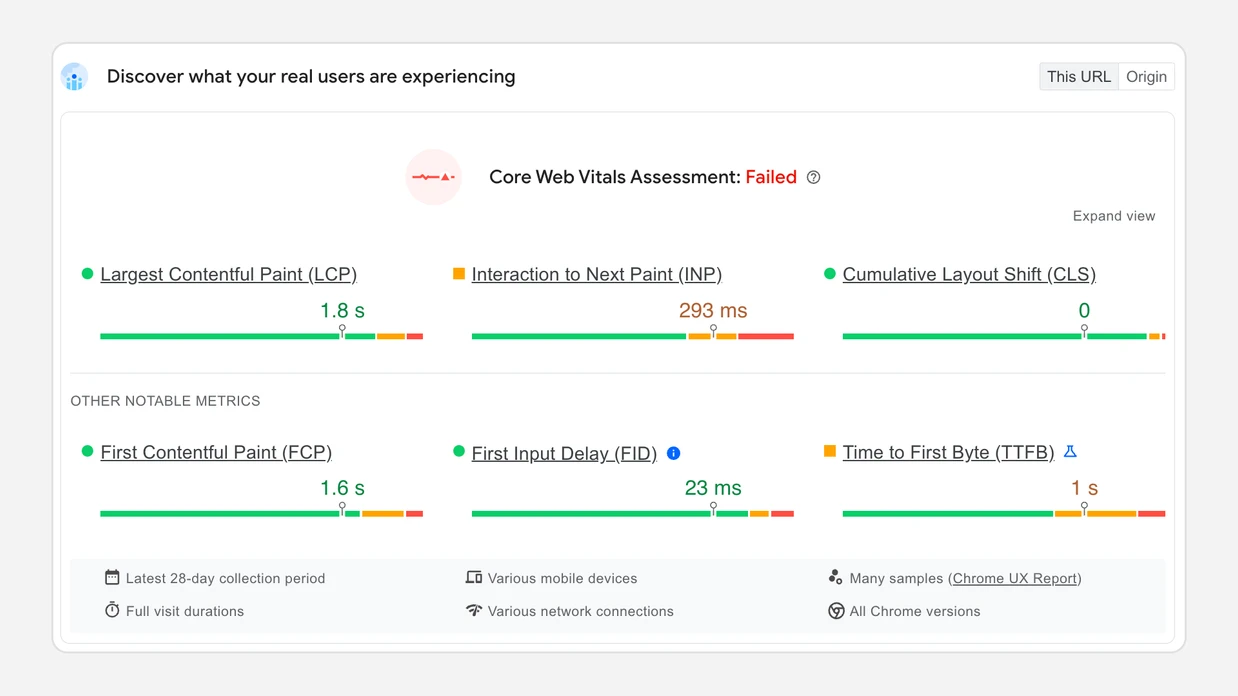
PageSpeed Insights tests four different things: performance, accessibility, best practices, and SEO. As an example, we’ll use our own website and perform the desktop test.
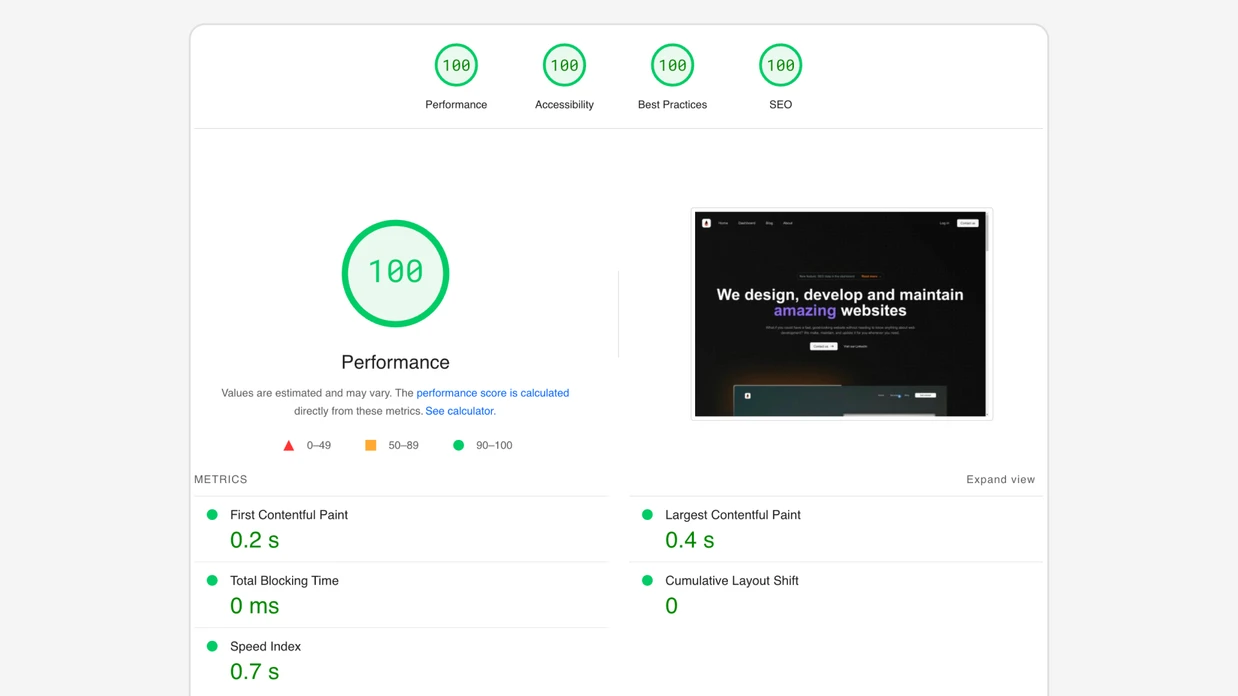
The first thing you’ll notice is how amazing our site is (you’re impressed, aren’t you?). The performance can vary a little bit depending on whether it’s hitting your CDN cache or not, etc. If you are using caching, we recommend running it again for potentially better results.
These performance metrics are considered lab data because they don’t come from real users; they come from a controlled, emulated environment. These are the most important metrics because if even one of these is bad, it’ll have a big impact on the user experience.
1. First Contentful Paint (FCP): Measures how quickly the first piece of content (text or image) appears on the screen.
2. Largest Contentful Paint (LCP): Measures the time it takes for the largest content element (such as an image or block of text) to become visible in the viewport.
3. Speed Index: Indicates how quickly the contents of a page are visibly populated during loading.
4. Cumulative Layout Shift (CLS): Measures the amount of unexpected layout shifts that occur during page load, affecting visual stability.
5. Time to Interactive (TTI): Measures how long it takes for a page to become fully interactive and respond to user input.
6. Total Blocking Time (TBT): Measures the total amount of time during which the main thread is blocked and unable to respond to user input.
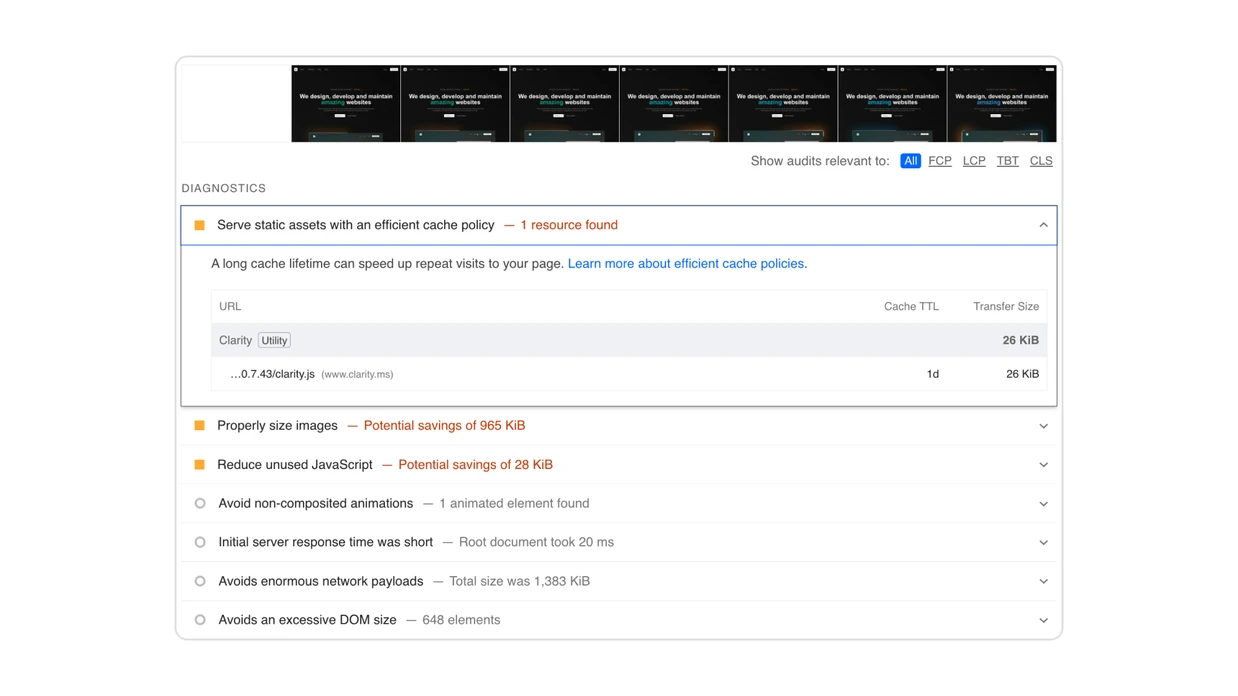
Here, we have two sections: one showing the different timestamps for the website as it loads in and one for the diagnostics. The timestamps are useful because you can see what elements are loading in what order, and you can also see how your animations are performing. For us, you can see that our entire site loads immediately, which is great. It may be hard to notice, but you can see that the moving border animation doesn’t start until the 5th screenshot.
The diagnostics are where the good stuff is. Here, you can see what’s slowing your site down, where you can gain some performance wins, etc.
For our site, you can see how PageSpeed Insights is warning us about some unused JavaScript, improperly sized images, and not having a cache policy. But as we discussed, PageSpeed Insights doesn’t know that we can’t really add caching to Microsoft Clarity, we purposefully oversize images a bit for quality, and the unused JavaScript is due to how we added React to our site.
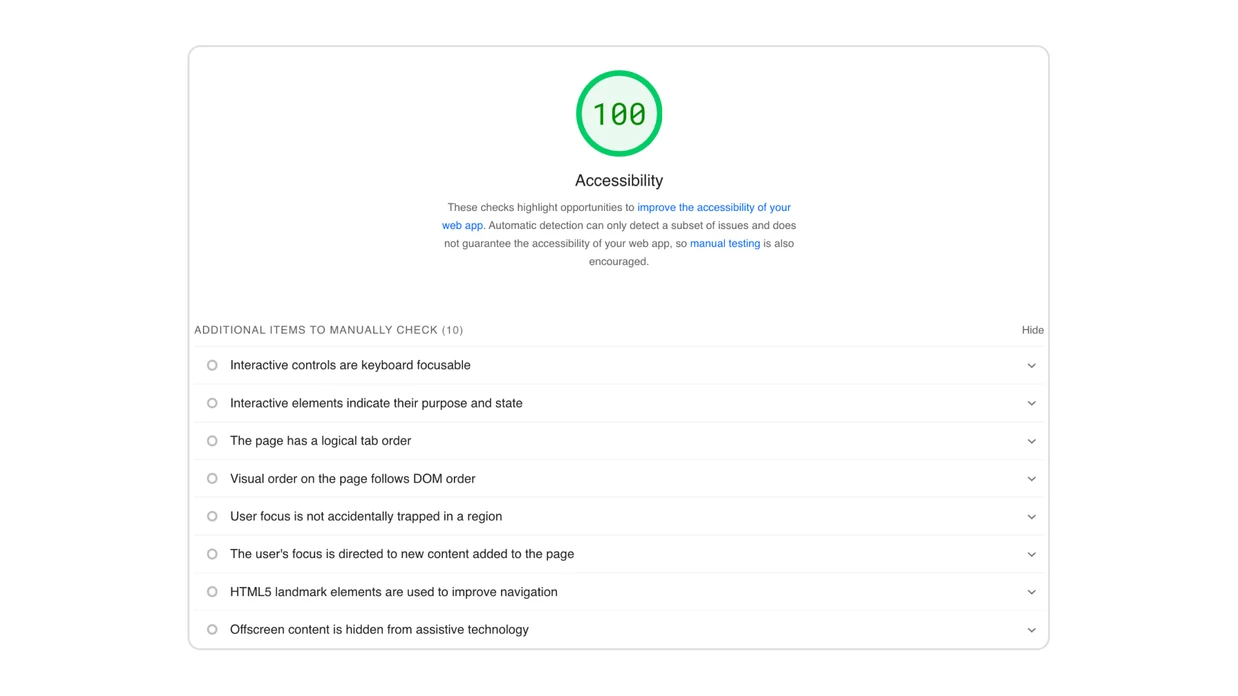
Accessibility ensures that your site functions as expected, elements have the correct props, interactive elements can be selected via the keyboard, etc. While these don’t affect the performance of your site, it’s usually good to make sure you don’t have accessibility problems since that may become a problem for some users.
This is to ensure your site isn’t using deprecated APIs, correctly uses web technologies, images have the correct aspect ratio, etc. Basically, it’s about making sure that you’re up to date with the best practices used across the web for building websites.
It checks for HTTPS usage, vulnerability to JavaScript libraries, and whether your website is configured to work on all devices (e.g., mobile-friendliness) and more.
These tend to be extremely easy to fix so there shouldn’t really be anything stopping you from having a 100% in this section. Sometimes having a website built on site builders like WordPress can have some issues with this since they rely on older web standards or are using experimental/custom code.
You’d think with such high importance placed on SEO these days, that PageSpeed Insights would have more to offer. But in reality, there are only a few technical aspects that can be tested. Things such as having a title, correct description length, crawl-able links, and more. It doesn’t evaluate content relevance, keyword optimisation, or other more advanced SEO strategies.
Google does take into account this metric so there is some impact on your Google search ranking
The only thing you would need to manually check is the structured data, which is a way of making your website more interactive on search engines. Structured data helps search engines understand the content of your pages better and can enhance your search results with rich snippets. Implementing structured data can be done using JSON-LD, Micro-data, or RDFa. Learn more about structured data.
If you are focused on SEO, you’d probably want to focus on the actual content of your site (something PageSpeed Insights can’t really do).
Once you run an insight, you can’t really return to it. However, you may want to compare performance changes after you push updates to your site, or perhaps you just don’t want to wait 30 seconds every time and prefer to see the previous scores. That’s why we added a feature to our dashboard where you can directly run PageSpeed Insights tests, and the results are saved for you.
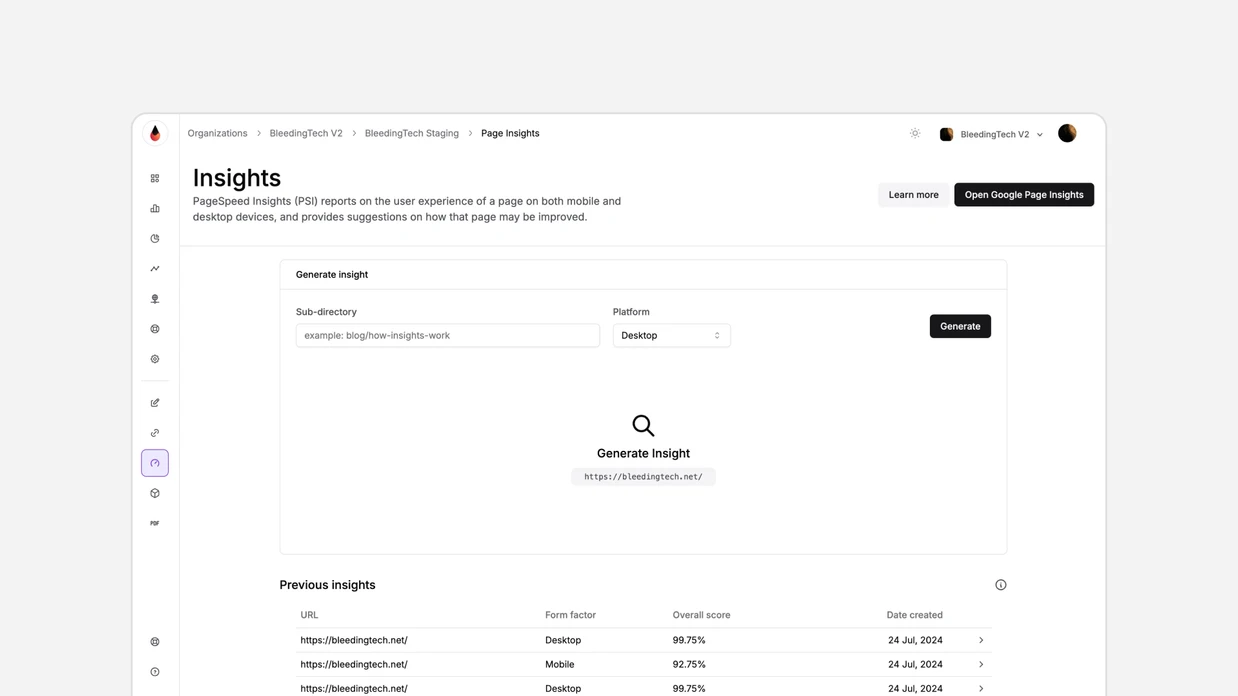
Understanding the difference between PageSpeed Insights and Lighthouse is crucial for effectively using these tools. While both provide valuable insights, they are only part of the equation in creating a successful website. It’s important to interpret the results in the context of your specific site and its goals. With tools like BleedingTech Dashboard, you can easily save and compare these insights, helping you track performance over time and make data-driven decisions for continuous improvement.